Spain Tourism Statistics
Spain recorded 96.80 million international tourist arrivals and EUR 134.74 billion in international tourist spending in 2025. Both increased, but spending grew faster than arrivals, while the average trip became slightly shorter. This report brings together official statistics on visitor markets, seasonality, attractions, regional hotel demand and tourism's economic contribution. 1,4
Most tourism figures below cover the full calendar year 2025. Economic statistics have a longer publication lag: the latest direct tourism GDP figure in the cited national account is for 2023, while broader tourism GDP and tourism-industry employment extend to 2024. 18
Spain tourism: key statistics
| Statistic | Latest figure | Reporting year | Source |
|---|---|---|---|
| International tourist arrivals | 96,803,894; up 3.25% | 2025 | S1; growth calculated |
| Largest source country | United Kingdom: 19.08 million arrivals; 19.71% of total | 2025 | S1-S2; share calculated |
| International tourist spending | EUR 134.743 billion; up 6.82% in nominal terms | 2025 | S4; growth calculated |
| Average international tourist spending | EUR 1,392 per trip; EUR 195 per day | 2025 | S4 |
| Busiest month | August: 11,227,218 international arrivals | 2025 | S5 |
| Leading region for hotel overnight stays | Canary Islands: 72,956,847 nights | 2025 | S12 |
| Highest hotel-tourism intensity | Balearic Islands: 50.72 hotel nights per resident | 2025 | S12-S13; Northbound calculation |
| Direct tourism contribution to GDP | EUR 89.422 billion; 6.0% of GDP | 2023, provisional | S18 |
1. How many tourists visit Spain, and is tourism growing?
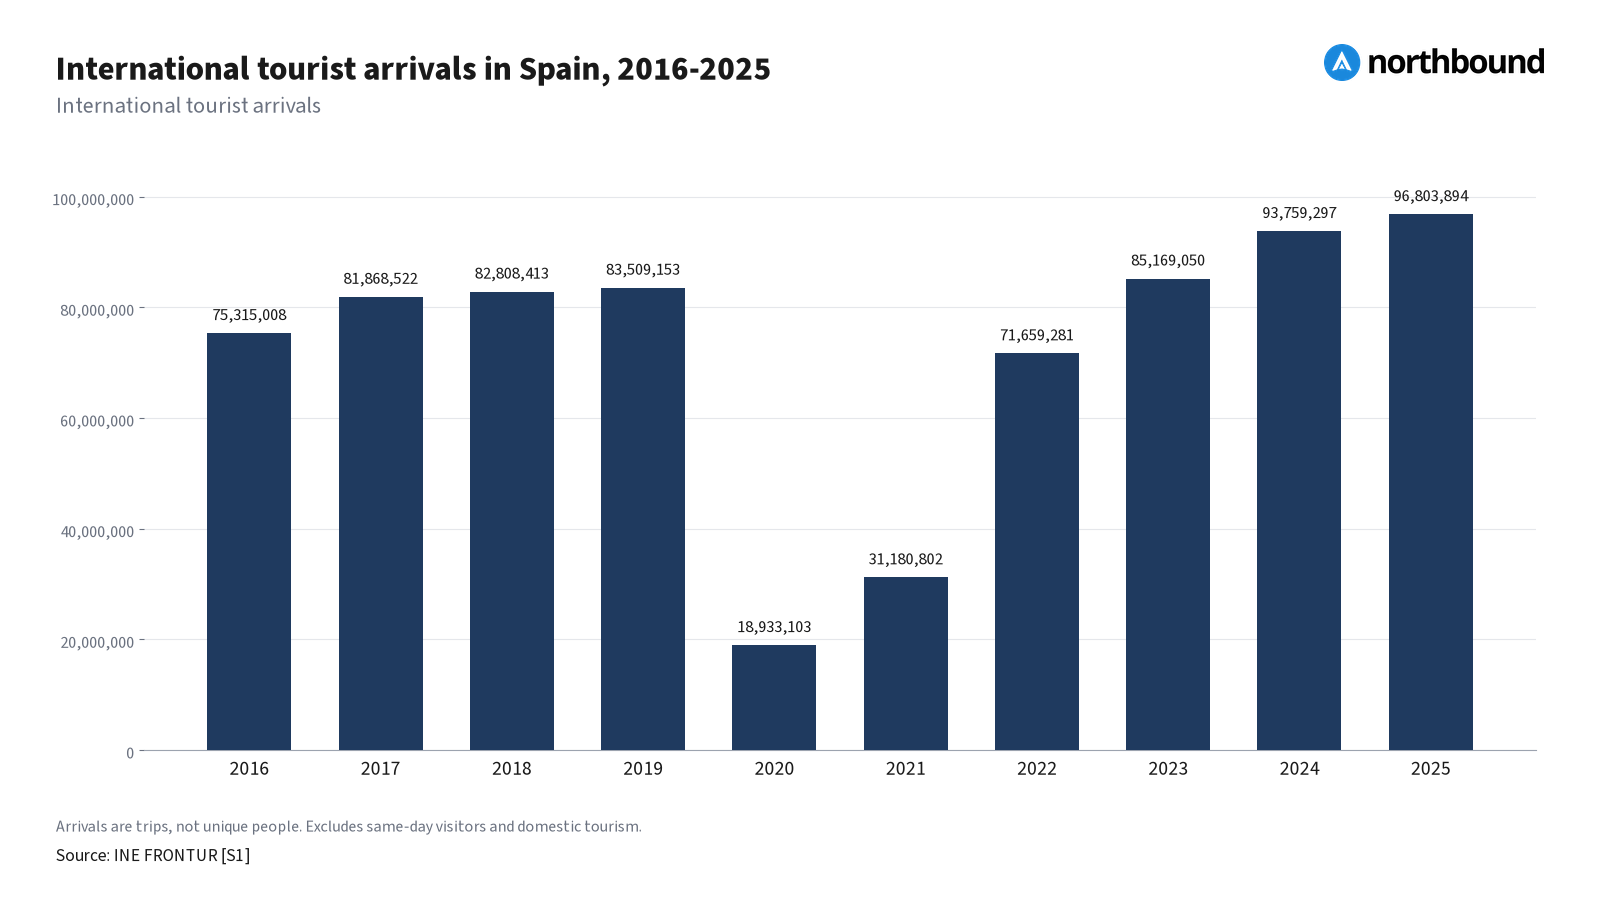
Spain received 96,803,894 international tourist arrivals in 2025, an increase of 3,044,597, or 3.25%, from 2024. This was another record year, not simply a return to pre-pandemic volumes: arrivals were 15.92% above 2019. 1
These are international overnight tourist trips, not unique people. A person making two visits can appear twice; domestic trips and same-day visitors are excluded. 1,5
| Year | International tourist arrivals |
|---|---|
| 2016 | 75,315,008 |
| 2017 | 81,868,522 |
| 2018 | 82,808,413 |
| 2019 | 83,509,153 |
| 2020 | 18,933,103 |
| 2021 | 31,180,802 |
| 2022 | 71,659,281 |
| 2023 | 85,169,050 |
| 2024 | 93,759,297 |
| 2025 | 96,803,894 |
Source: INE FRONTUR annual series, reproduced by CREM; revised 2025 annual data. 1
The useful finding: growth continued but slowed. Arrivals rose 10.09% in 2024 and 3.25% in 2025. The annual total first exceeded the 2019 level in 2023. These comparisons are Northbound calculations from the same annual series. 1
2. Which countries do the most tourists come from?
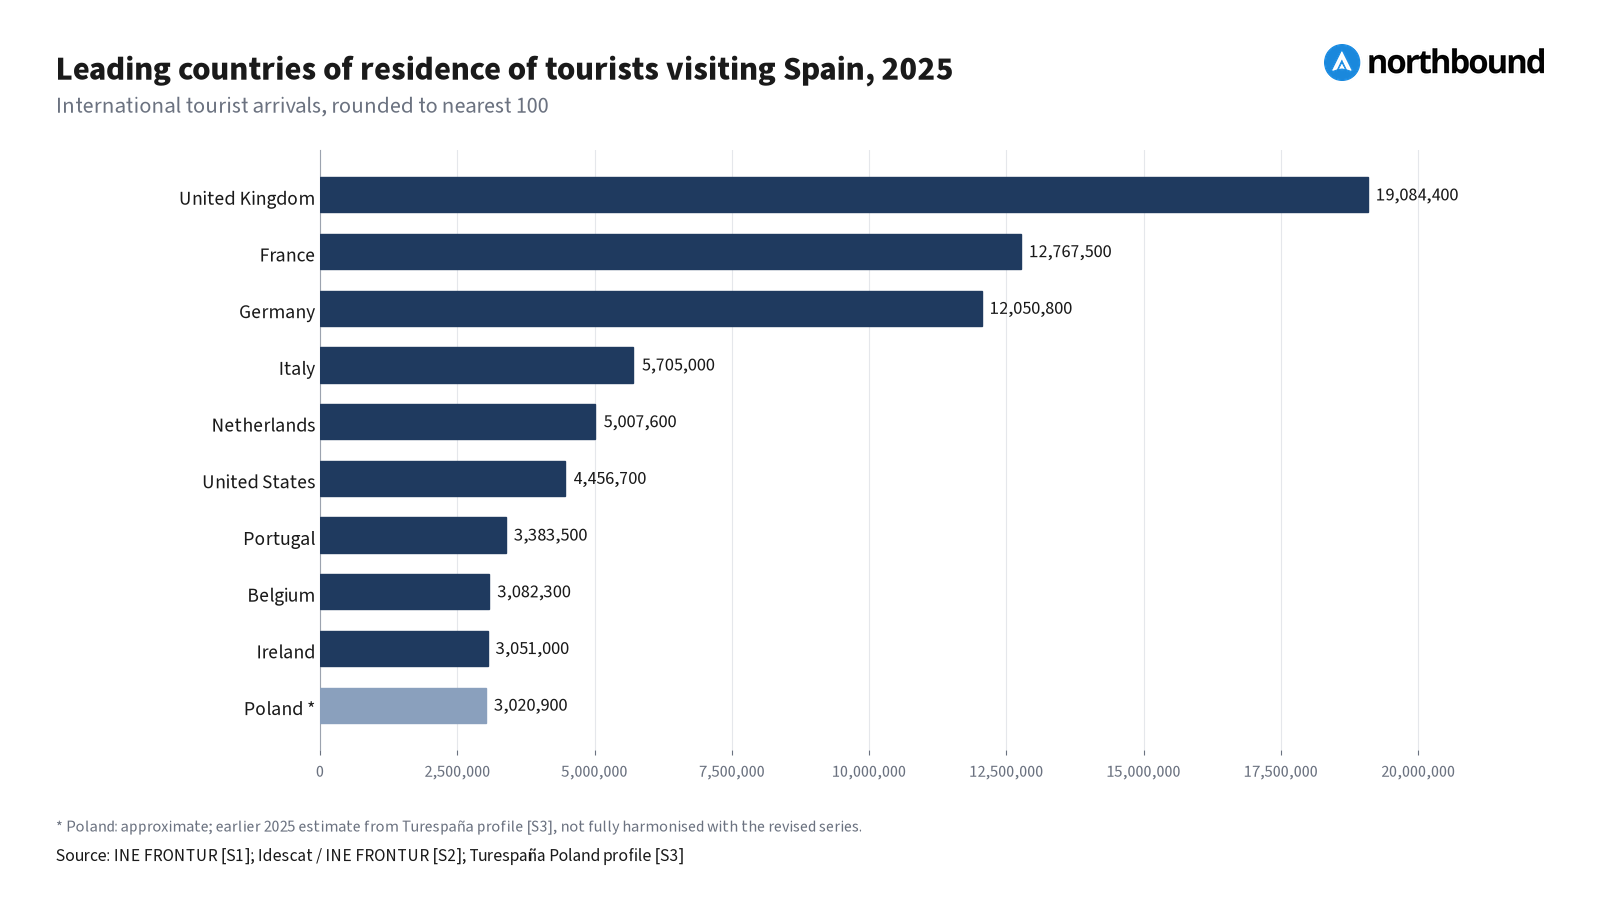
The United Kingdom was Spain's largest source market in 2025, followed by France and Germany. Together, these three countries supplied 45.35% of international tourist arrivals. The classification is country of residence, not nationality. 1,2
| Rank | Country of residence | 2025 arrivals, rounded to 100 | Share of all arrivals | Change from 2024 |
|---|---|---|---|---|
| 1 | United Kingdom | 19,084,400 | 19.71% | +3.8% |
| 2 | France | 12,767,500 | 13.19% | -1.2% |
| 3 | Germany | 12,050,800 | 12.45% | +0.9% |
| 4 | Italy | 5,705,000 | 5.89% | +3.8% |
| 5 | Netherlands | 5,007,600 | 5.17% | +4.7% |
| 6 | United States | 4,456,700 | 4.60% | +4.5% |
| 7 | Portugal | 3,383,500 | 3.50% | +13.4% |
| 8 | Belgium | 3,082,300 | 3.18% | +0.7% |
| 9 | Ireland | 3,051,000 | 3.15% | +10.2% |
| 10 | Poland * | 3,020,900 | 3.12% | +23.6% |
Sources: revised INE FRONTUR country figures reproduced by Idescat, plus Turespana's Poland profile. Growth rates follow the published source; shares are Northbound calculations. Counts are rounded to the nearest 100, matching the precision of the Idescat table. 1,2,3
*Poland is approximately 3.02 million arrivals. Its May 2026 profile retains an earlier estimate for 2025, so its count, share and reported 23.6% growth should not be read as fully harmonised with the revised country series. Turespana identifies Poland as the tenth-largest arrival market. 3
The useful finding: among these substantial markets, Poland's separately reported growth was especially strong. In the revised series, Portugal grew 13.4% and Ireland 10.2%, while France fell 1.2%. These are not growth headlines based on tiny visitor totals: each market in this table supplied approximately three million arrivals or more. 2,3
3. How much do tourists spend in Spain?
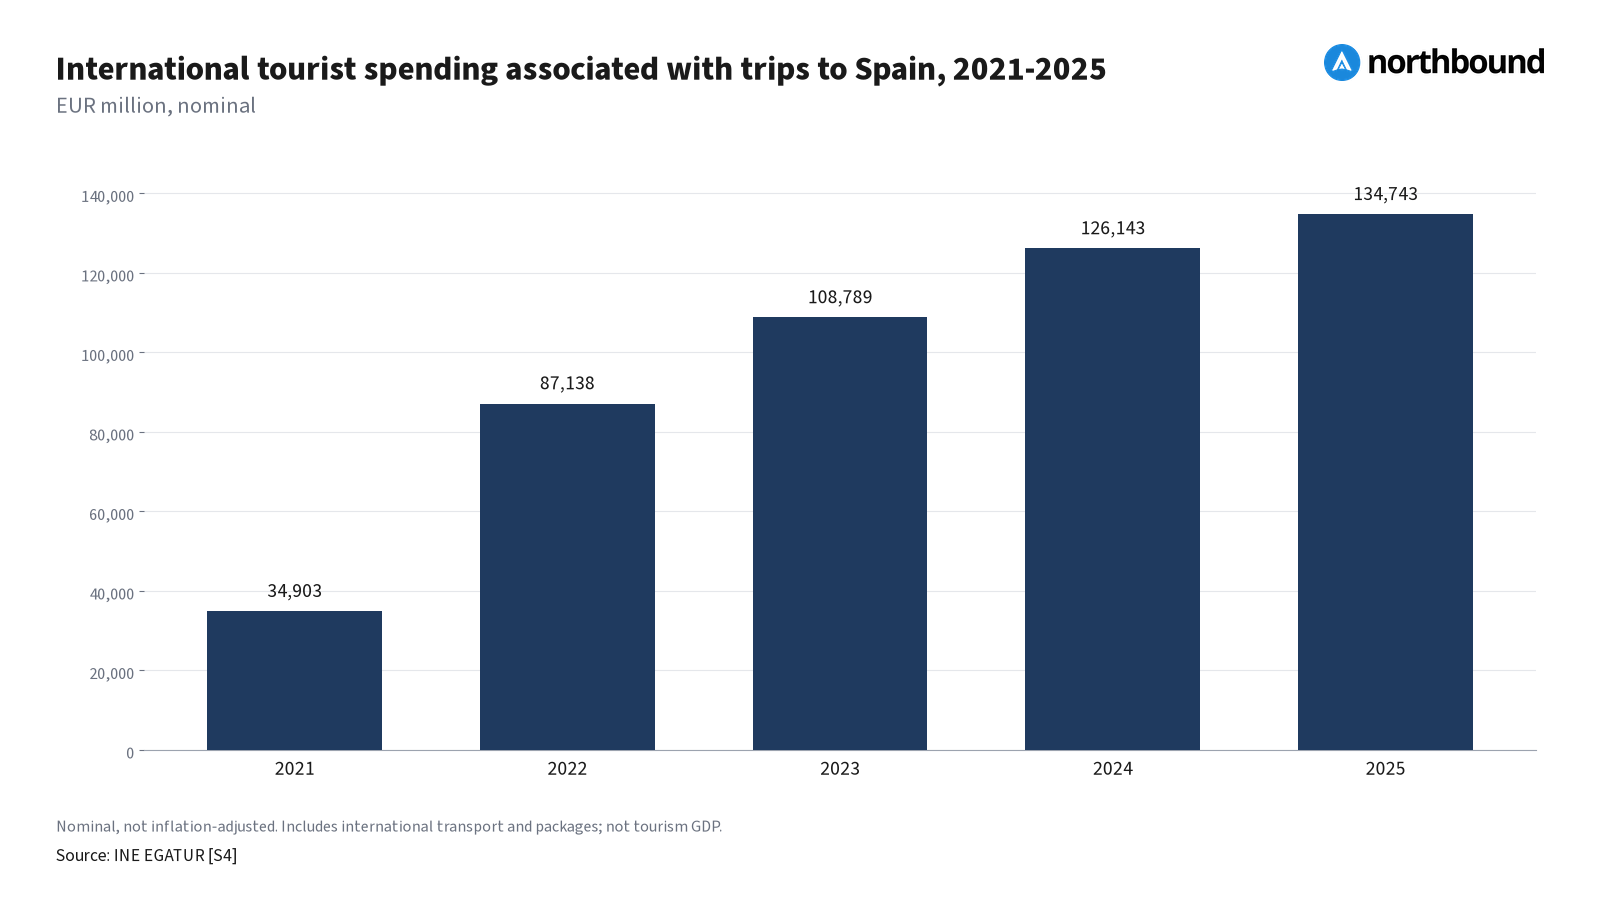
International tourists spent EUR 134.743 billion on trips to Spain in 2025, up 6.82% from 2024. Reported average expenditure was EUR 1,392 per trip and EUR 195 per day. All monetary figures here are nominal, not inflation-adjusted. 4
| Year | Total spending, EUR billion | Average per trip, EUR | Average per day, EUR |
|---|---|---|---|
| 2021 | 34.903 | 1,119 | 137 |
| 2022 | 87.138 | 1,216 | 162 |
| 2023 | 108.789 | 1,277 | 177 |
| 2024 | 126.143 | 1,345 | 186 |
| 2025 | 134.743 | 1,392 | 195 |
Source: INE EGATUR annual series, reproduced by CREM. 4
What the spending measure includes: reported expenditure associated with the trip, including package holidays, international transport, accommodation, food, activities and other spending. It is not just money paid at businesses after arrival, and it should not be described as income retained in Spain or as tourism's GDP contribution. 4
The useful finding: spending growth reflected more arrivals and higher spending per day, not longer trips. Arrivals rose 3.25%; average spending per trip rose approximately 3.5%, and daily expenditure approximately 4.8%, using the rounded published averages. Average trip duration edged down from 7.2 to 7.1 days. These are descriptive comparisons, not an inflation-adjusted or causal decomposition. 1,4
4. Most visited attractions with published visitor figures
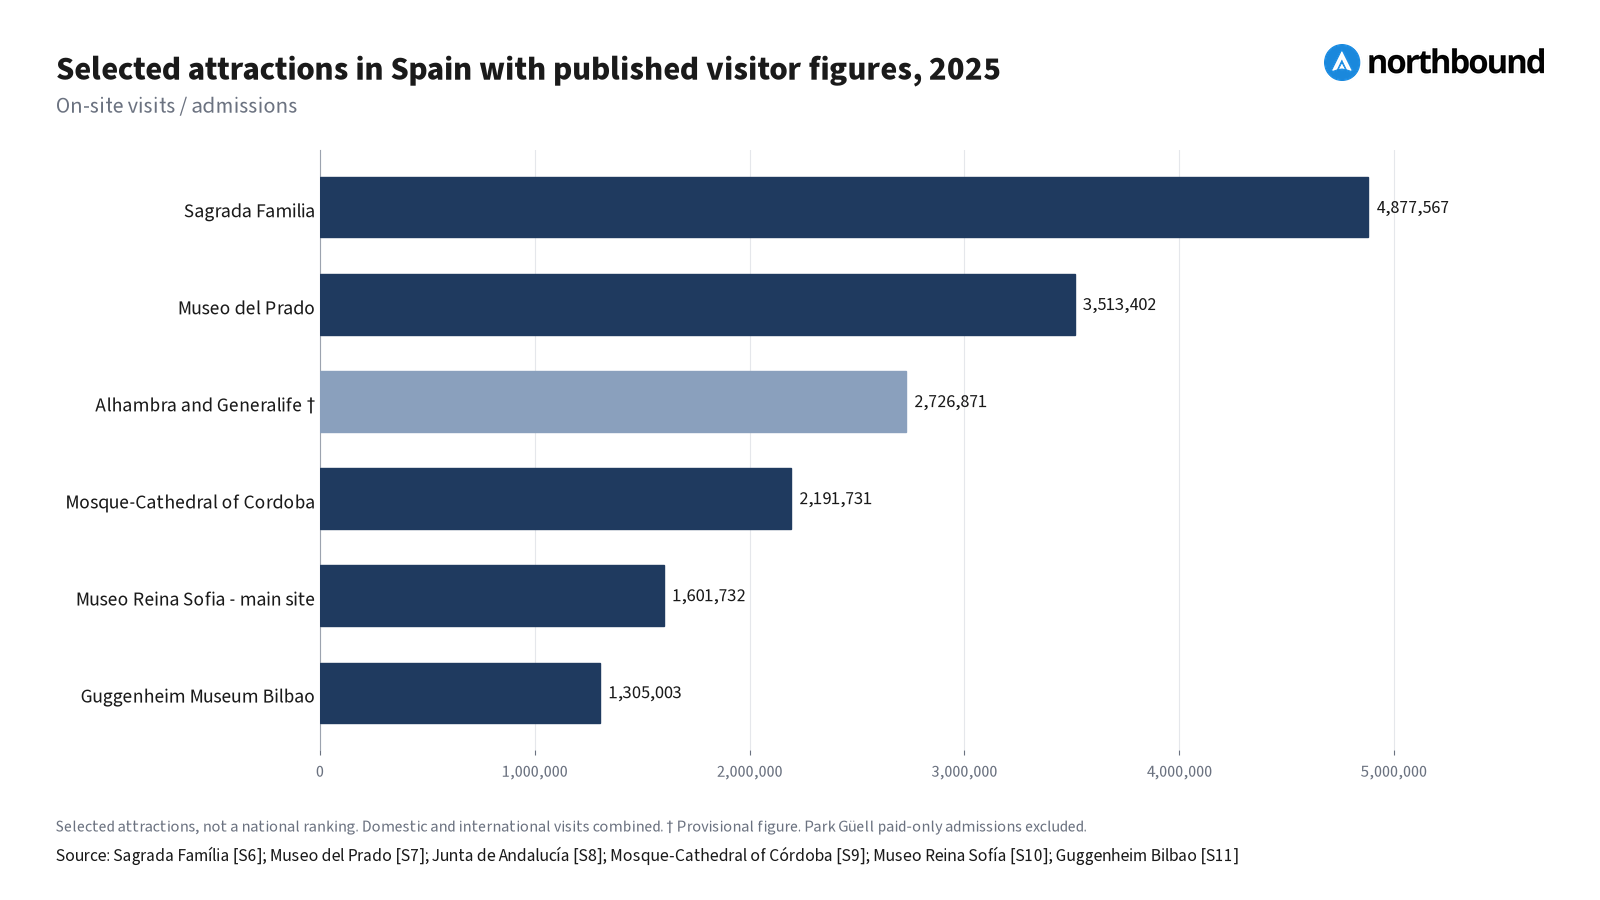
Sagrada Familia recorded 4,877,567 visits in 2025, the highest count among the six cultural attractions compared below. This is a selected comparison of attractions with usable published figures, not a definitive ranking of every attraction in Spain. 6,7,8,9,10,11
| Attraction | Location | Visits / admissions | Year | Source |
|---|---|---|---|---|
| Sagrada Familia | Barcelona | 4,877,567 | 2025 | S6 |
| Museo del Prado | Madrid | 3,513,402 | 2025 | S7 |
| Alhambra and Generalife | Granada | 2,726,871 (provisional) | 2025 | S8 |
| Mosque-Cathedral of Cordoba | Cordoba | 2,191,731 | 2025 | S9 |
| Museo Reina Sofia - main site | Madrid | 1,601,732 | 2025 | S10 |
| Guggenheim Museum Bilbao | Bilbao | 1,305,003 | 2025 | S11 |
The counts combine domestic and international visitors and are visits, not deduplicated people. Free and paid admissions are included where included in each operator's headline attendance measure. They do not identify how many international tourists visited each site. 6,7,8,9,10,11
The Prado figure excludes its off-site exhibitions; Reina Sofia covers its main museum site, not additional library and activity attendance. Separate visits to exhibitions or components of a complex have not been added together. 7,8,9,10
An important coverage gap: Park Guell reports 4,369,157 paid tourist visits for 2025, alongside separate free-access categories. That paid-only figure is not inserted into a chart of overall on-site attendance. Omitting it does not mean it receives fewer visits than the sites above. 19
5. What are Spain's busiest and quietest months?
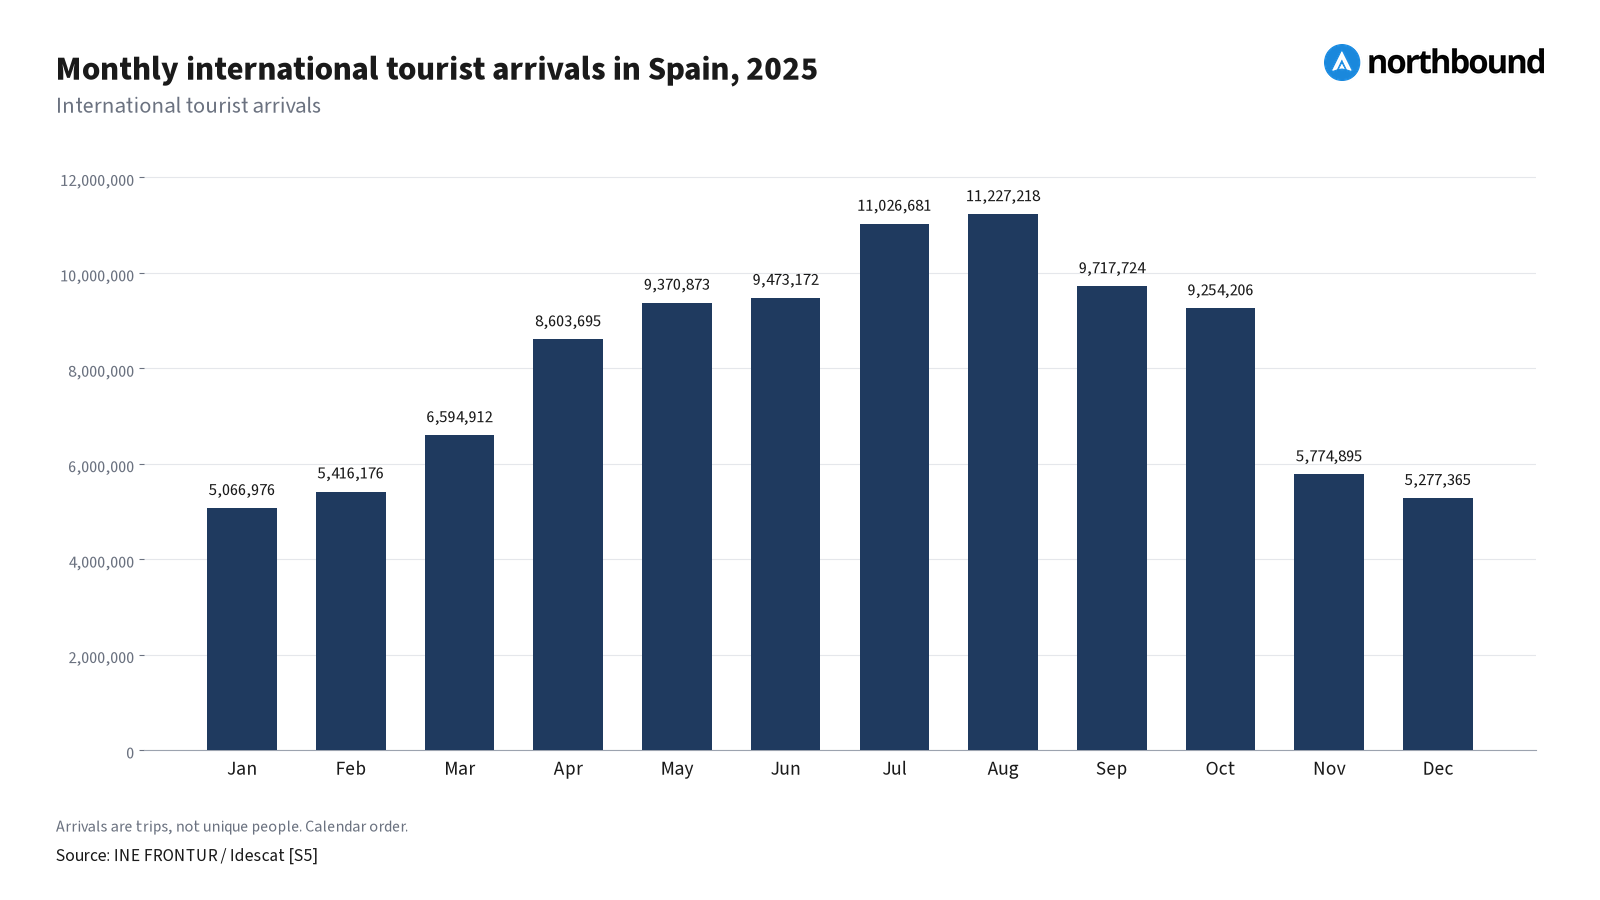
August was the busiest month in 2025, with 11.23 million international tourist arrivals; January was the quietest, with 5.07 million. The three busiest months were July, August and September, together accounting for 33.03% of the annual total. 1,5(Northbound calculation)
| Month, 2025 | International tourist arrivals |
|---|---|
| January | 5,066,976 |
| February | 5,416,176 |
| March | 6,594,912 |
| April | 8,603,695 |
| May | 9,370,873 |
| June | 9,473,172 |
| July | 11,026,681 |
| August | 11,227,218 |
| September | 9,717,724 |
| October | 9,254,206 |
| November | 5,774,895 |
| December | 5,277,365 |
Source: INE FRONTUR monthly series, cross-checked against Idescat's Spain tourist series. 5
How much quieter are the months beside the peak?
Defining the peak as the three busiest months, July-September, the immediately adjacent months are June and October. June's 9.47 million arrivals were 15.62% below August, while October's 9.25 million were 17.57% below August. These are comparisons of calendar-month totals, not arrivals per day. 5(Northbound calculations)
Is tourism becoming less seasonal?
The July-September share of annual arrivals declined from 34.53% in 2019 to 33.47% in 2024 and 33.03% in 2025. That is a modest 1.50-percentage-point reduction since 2019: tourism became somewhat less concentrated in these months, but the national data do not show seasonality disappearing. 1,5(Northbound calculations)
National totals do not measure crowding at individual attractions. For example, the Mosque-Cathedral of Cordoba reported April and October as its busiest months in 2025, rather than the national arrival peak in August. 9
6. Which regions are most visited, and which are growing fastest?
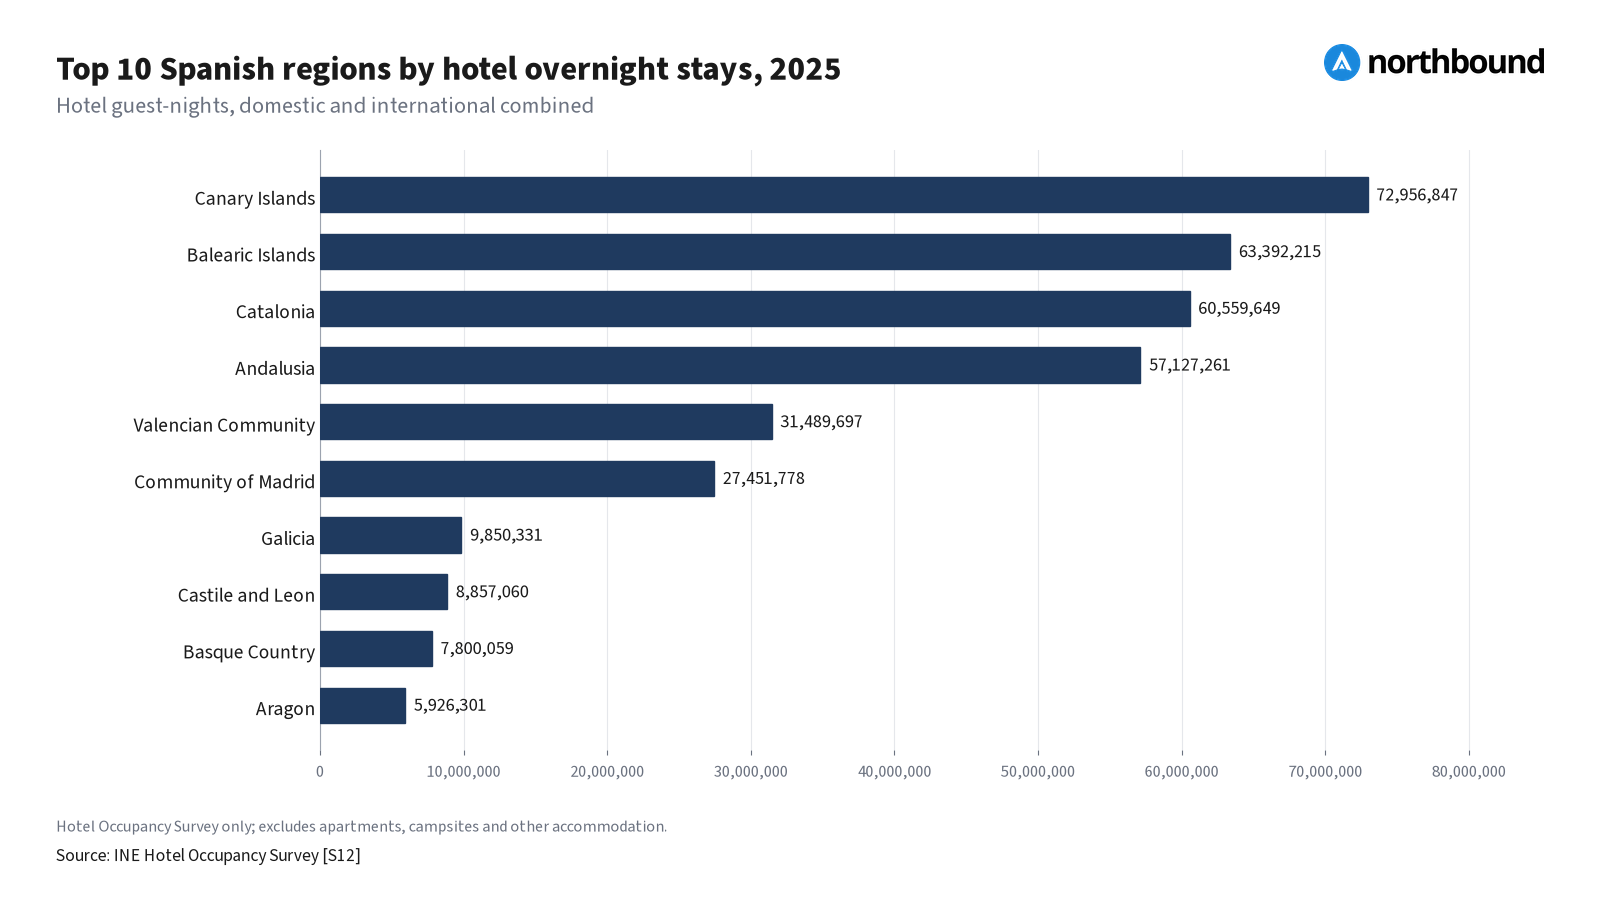
The Canary Islands recorded Spain's most hotel overnight stays in 2025: 72.96 million, or 19.93% of the national total. The Balearic Islands, Catalonia and Andalusia followed. This ranking uses hotel guest-nights from both domestic and international travellers; it is not a ranking of all tourism accommodation or unique visitors. 12
| Region | Hotel nights, 2025 | Share of national hotel nights | Change from 2024 |
|---|---|---|---|
| Canary Islands | 72,956,847 | 19.93% | +0.09% |
| Balearic Islands | 63,392,215 | 17.31% | +0.56% |
| Catalonia | 60,559,649 | 16.54% | +0.22% |
| Andalusia | 57,127,261 | 15.60% | +0.93% |
| Valencian Community | 31,489,697 | 8.60% | +1.41% |
| Community of Madrid | 27,451,778 | 7.50% | +2.50% |
| Galicia | 9,850,331 | 2.69% | +0.33% |
| Castile and Leon | 8,857,060 | 2.42% | +0.83% |
| Basque Country | 7,800,059 | 2.13% | +6.56% |
| Aragon | 5,926,301 | 1.62% | +1.35% |
Source: INE Hotel Occupancy Survey, reproduced by CREM. National totals: 366,146,835 nights in 2025 and 363,065,079 in 2024. Shares and changes are Northbound calculations. 12
Fastest-growing significant regions
To avoid small-base headlines, "significant" means a region accounting for at least 1% of Spain's hotel nights in 2024. [Northbound analytical definition]
| Region | Hotel-night growth, 2025 | Additional hotel nights |
|---|---|---|
| Basque Country | +6.56% | +479,906 |
| Castile-La Mancha | +5.00% | +203,953 |
| Community of Madrid | +2.50% | +670,833 |
The Basque Country led percentage growth among these significant regions, against national growth of 0.85%. Madrid recorded the largest absolute increase of any region, adding 670,833 hotel nights. 12(Northbound calculations)
Tourism was not concentrated in the capital region: 92.50% of hotel nights occurred outside the Community of Madrid. Even the leading region, the Canary Islands, represented only 19.93%, leaving 80.07% outside it. Nevertheless, the two island regions together accounted for 37.24% of all hotel nights. 12(Northbound calculations)
7. How long do tourists stay in Spain?
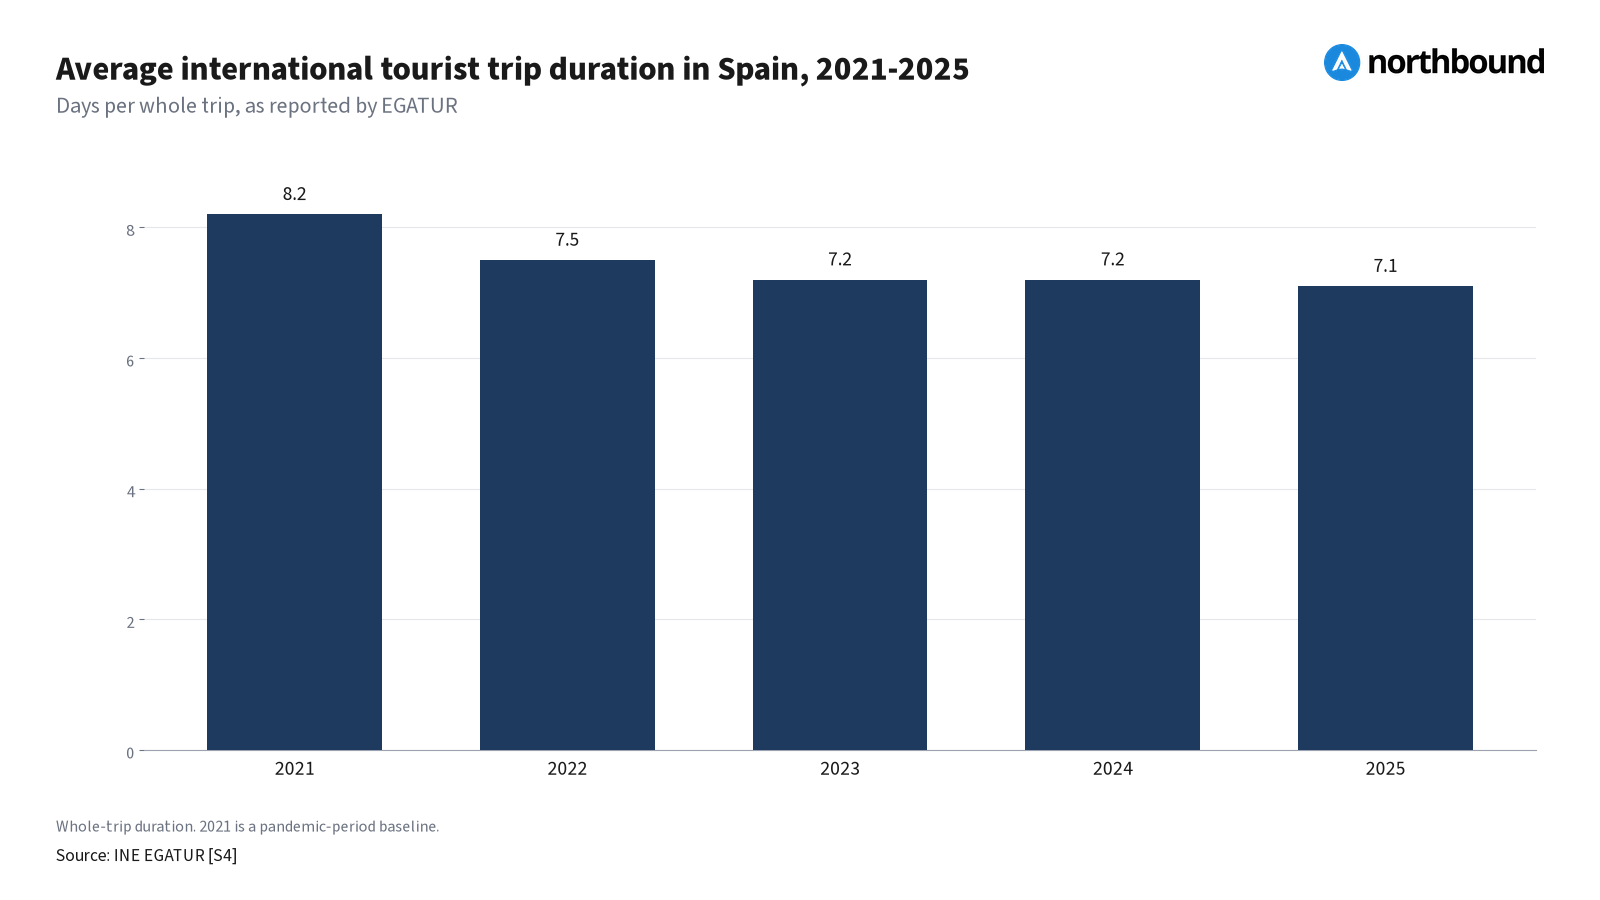
The average international tourist trip lasted 7.1 days in 2025, compared with 7.2 in 2024 and 8.2 in 2021. These are whole-trip duration measures reported by EGATUR, not the average number of nights spent in a single hotel. 4
| Year | Average whole-trip duration, days |
|---|---|
| 2021 | 8.2 |
| 2022 | 7.5 |
| 2023 | 7.2 |
| 2024 | 7.2 |
| 2025 | 7.1 |
The useful finding: the latest data do not support a story that visitors are staying longer. The recent decline is small, however, and 2021 is an unusual pandemic-period starting point rather than a normal baseline for visitor behaviour. 4
Selected source-market comparisons
Turespana's 2025 market profiles report the following average stays. Their unit is nights, as published, so these figures are kept separate from the national table's reported days. These four markets are a selected comparison, not a ranking of all source countries. Some profiles retain earlier estimates for 2025. 14,15,16,17
| Country of residence | Average stay, nights, 2025 | Source |
|---|---|---|
| Germany | 7.8 | S14 |
| Netherlands | 7.7 | S15 |
| United Kingdom | 6.8 | S16 |
| Portugal | 4.0 | S17 |
German and Dutch visitors stayed longer on average than British and Portuguese visitors in these profiles. This does not establish which market had the longest stays across all countries. 14,15,16,17
8. Which regions have the most tourism relative to their population?
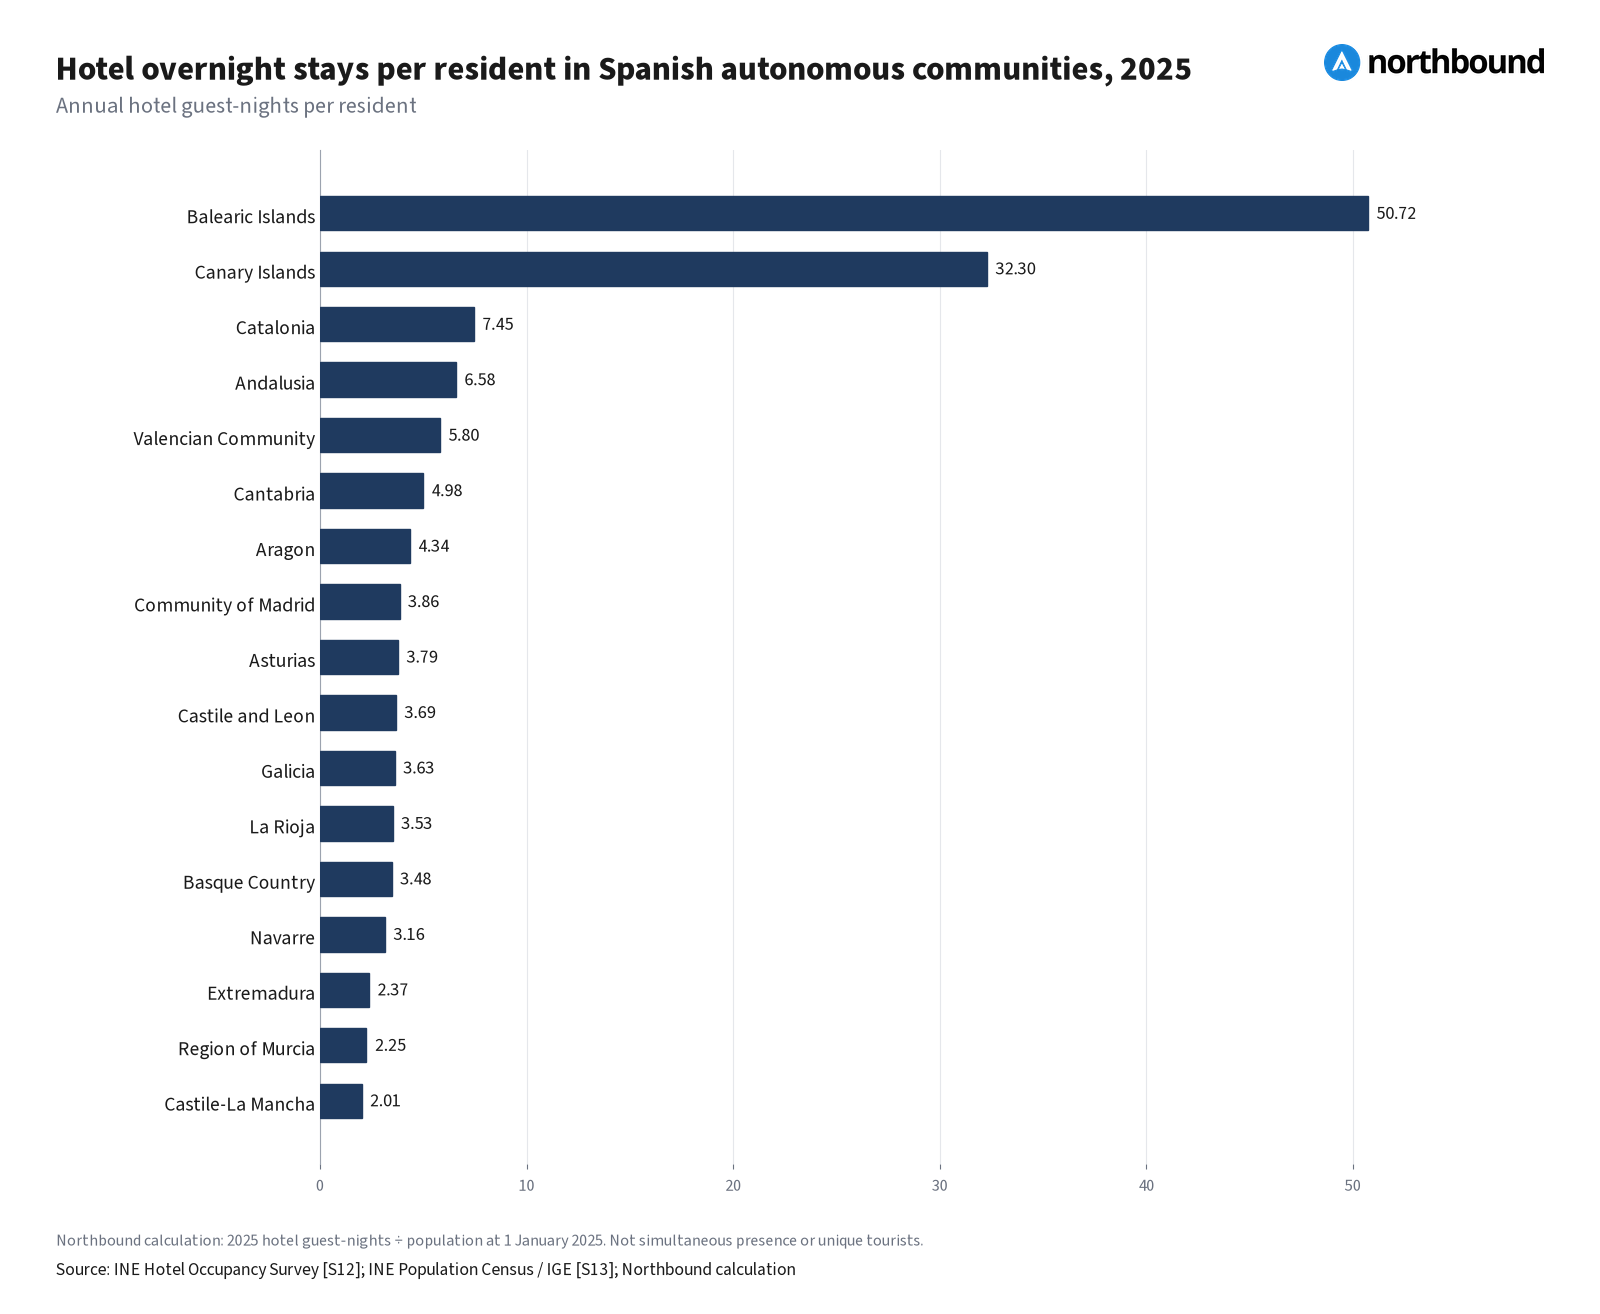
The Balearic Islands had Spain's highest hotel-tourism intensity in 2025: 50.72 hotel overnight stays per resident, compared with 32.30 in the Canary Islands and a national average of 7.45. The Balearics rank first on this measure even though the Canaries recorded more hotel nights in absolute terms. 12,13(Northbound calculations)
The calculation is annual hotel guest-nights divided by the resident population at 1 January 2025. Hotel nights include both domestic and international travellers. 12,13
| Autonomous community | Hotel nights, 2025 | Residents, 1 Jan 2025 | Hotel nights per resident |
|---|---|---|---|
| Balearic Islands | 63,392,215 | 1,249,844 | 50.72 |
| Canary Islands | 72,956,847 | 2,258,866 | 32.30 |
| Catalonia | 60,559,649 | 8,124,126 | 7.45 |
| Andalusia | 57,127,261 | 8,676,713 | 6.58 |
| Valencian Community | 31,489,697 | 5,425,182 | 5.80 |
| Cantabria | 2,954,731 | 593,623 | 4.98 |
| Aragon | 5,926,301 | 1,364,621 | 4.34 |
| Community of Madrid | 27,451,778 | 7,113,886 | 3.86 |
| Asturias | 3,844,623 | 1,015,128 | 3.79 |
| Castile and Leon | 8,857,060 | 2,401,221 | 3.69 |
| Galicia | 9,850,331 | 2,714,741 | 3.63 |
| La Rioja | 1,152,435 | 326,803 | 3.53 |
| Basque Country | 7,800,059 | 2,242,343 | 3.48 |
| Navarre | 2,161,430 | 683,854 | 3.16 |
| Extremadura | 2,491,363 | 1,053,345 | 2.37 |
| Region of Murcia | 3,565,825 | 1,586,989 | 2.25 |
| Castile-La Mancha | 4,283,191 | 2,126,378 | 2.01 |
Sources: INE Hotel Occupancy Survey and Annual Population Census; official regional reproductions by CREM and IGE. Ratios calculated by Northbound. The table covers the 17 autonomous communities; the national benchmark also includes Ceuta and Melilla. 12,13
Interpretation: this ratio describes annual hotel-night intensity relative to population. It is not the number of tourists physically present at one time, is not a count of unique tourists per resident, and is not proof of overcrowding. It also excludes apartments, campsites, rural accommodation and other non-hotel stays. 12,13(methodological interpretation)
9. How important is tourism to Spain's economy?
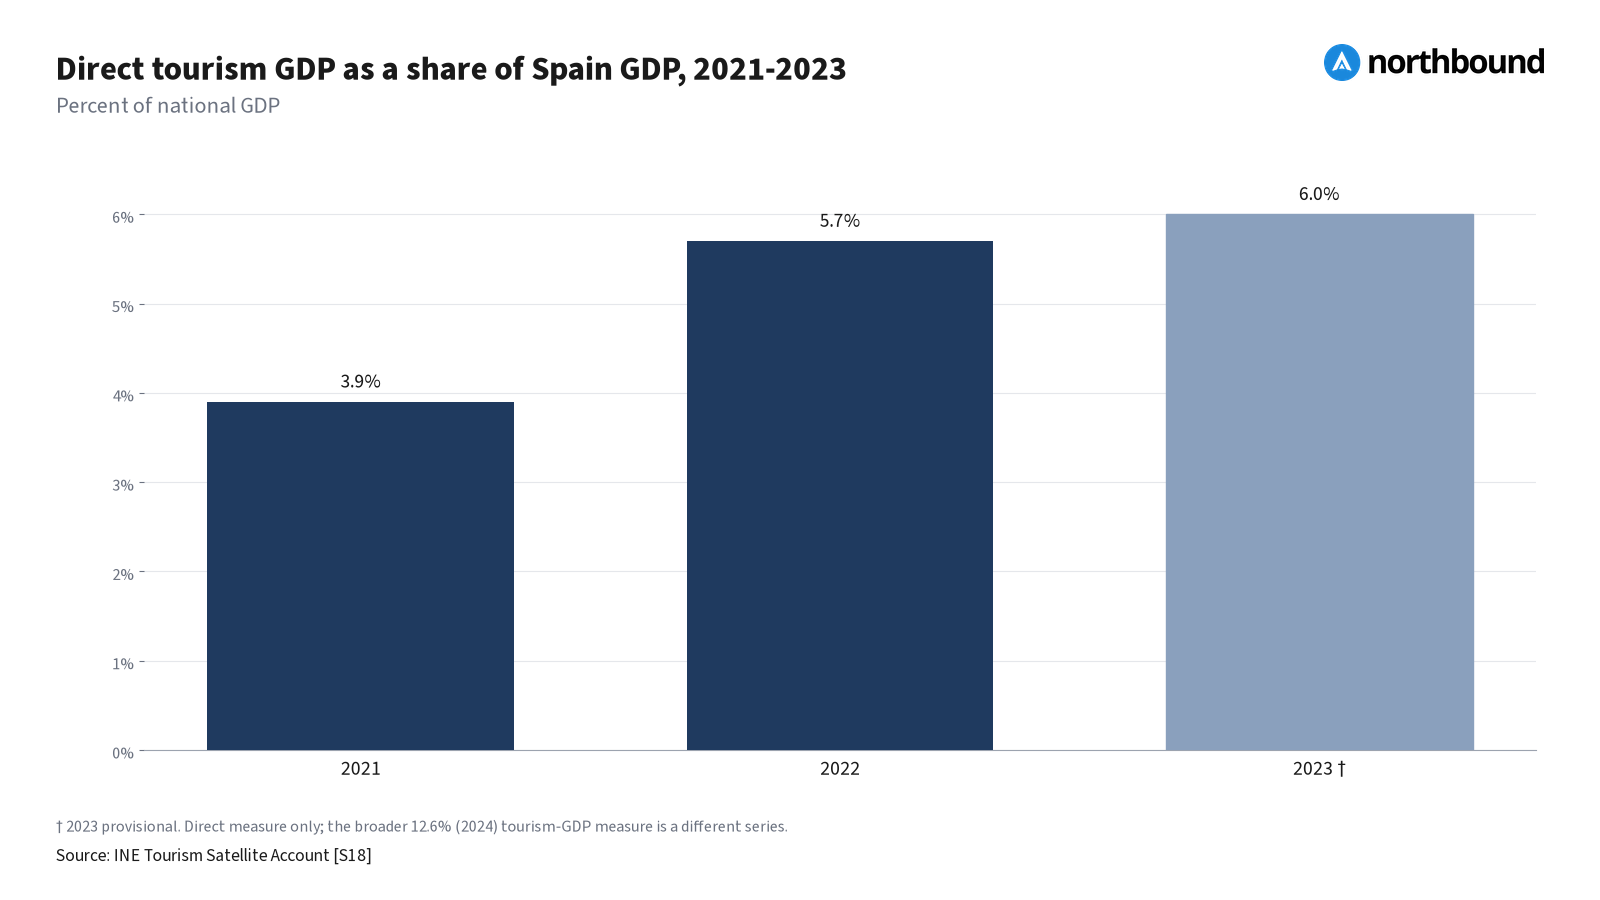
Spain's latest published direct tourism GDP figure in the national tourism account is EUR 89.422 billion, or 6.0% of GDP, for 2023. The often-quoted 12.6% figure for 2024 is a separate, broader tourism-GDP measure, not the direct measure requested here. 18
| Indicator | Amount | Share of economy | Year / status |
|---|---|---|---|
| Direct tourism GDP | EUR 89.422 billion | 6.0% of GDP | 2023, provisional |
| Broader INE tourism GDP | EUR 200.699 billion | 12.6% of GDP | 2024, advance estimate |
| Jobs in tourism-characteristic industries | 2,776,700 jobs | 12.3% of employment | 2024, advance estimate |
Employment limitation: the 2.78 million figure counts jobs in tourism-characteristic industries. It should not be relabelled as employment directly attributable to tourist demand. A separate comparable direct-tourism-employment figure is not supplied in the cited headline account, so none is substituted here. 18
A short consistent series is available for the direct GDP share:
| Year | Direct tourism GDP, EUR billion | Share of GDP |
|---|---|---|
| 2021 | 48.627 | 3.9% |
| 2022 | 79.107 | 5.7% |
| 2023 (provisional) | 89.422 | 6.0% |
Source: INE, Spanish Tourism Satellite Account, 2021-2024 series. The chart deliberately stops at 2023 rather than appending the incompatible broader 2024 percentage. 18
 English
 Deutsch
 Français
 Español
 Italiano